- You are here:
- Home »
- Blog »
- Power BI »
- Dashboard Alerts on Power BI Usage Metrics

Dashboard Alerts on Power BI Usage Metrics
Within each Power BI tenant, usage metrics are available not just for administrators, but for all content-creators. A usage metric report can be generated for any individual dashboard or report. In this blog post, we will see how you can combine usage metric reporting with Power BI alerts feature to get notified when one of your creations reaches an important viewing milestone.
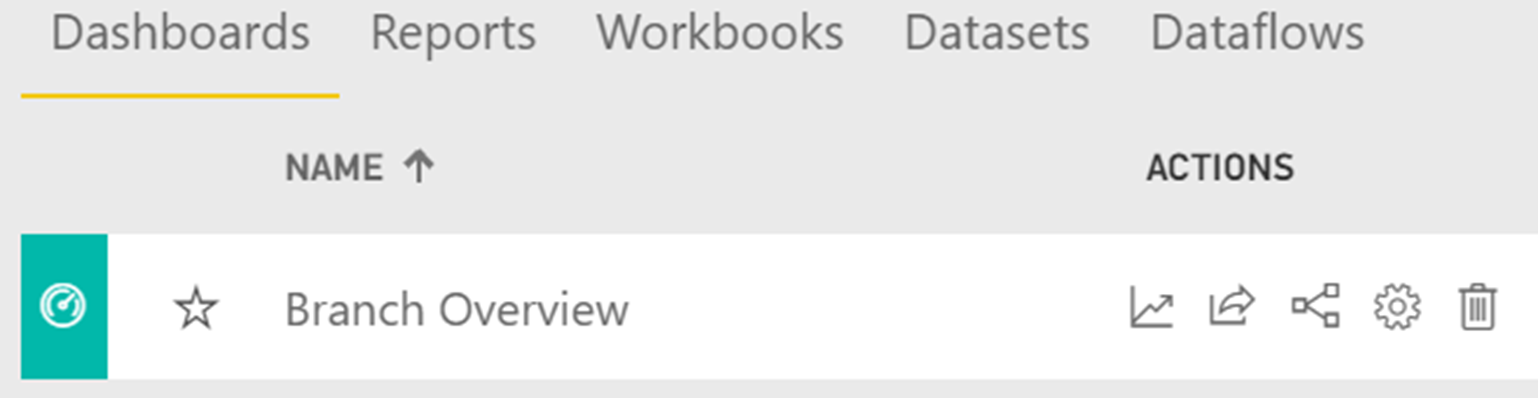
There are two ways of accessing usage metrics. Firstly, while viewing the list of either dashboards or reports, click on the View Usage Metrics Report icon next to the name of a dashboard or report.
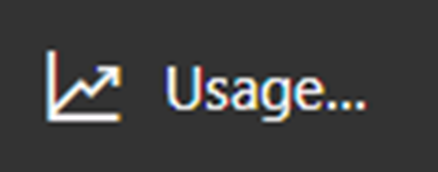
Secondly, while viewing a dashboard or report, click on the View Usage Metrics Report icon on the menu bar.
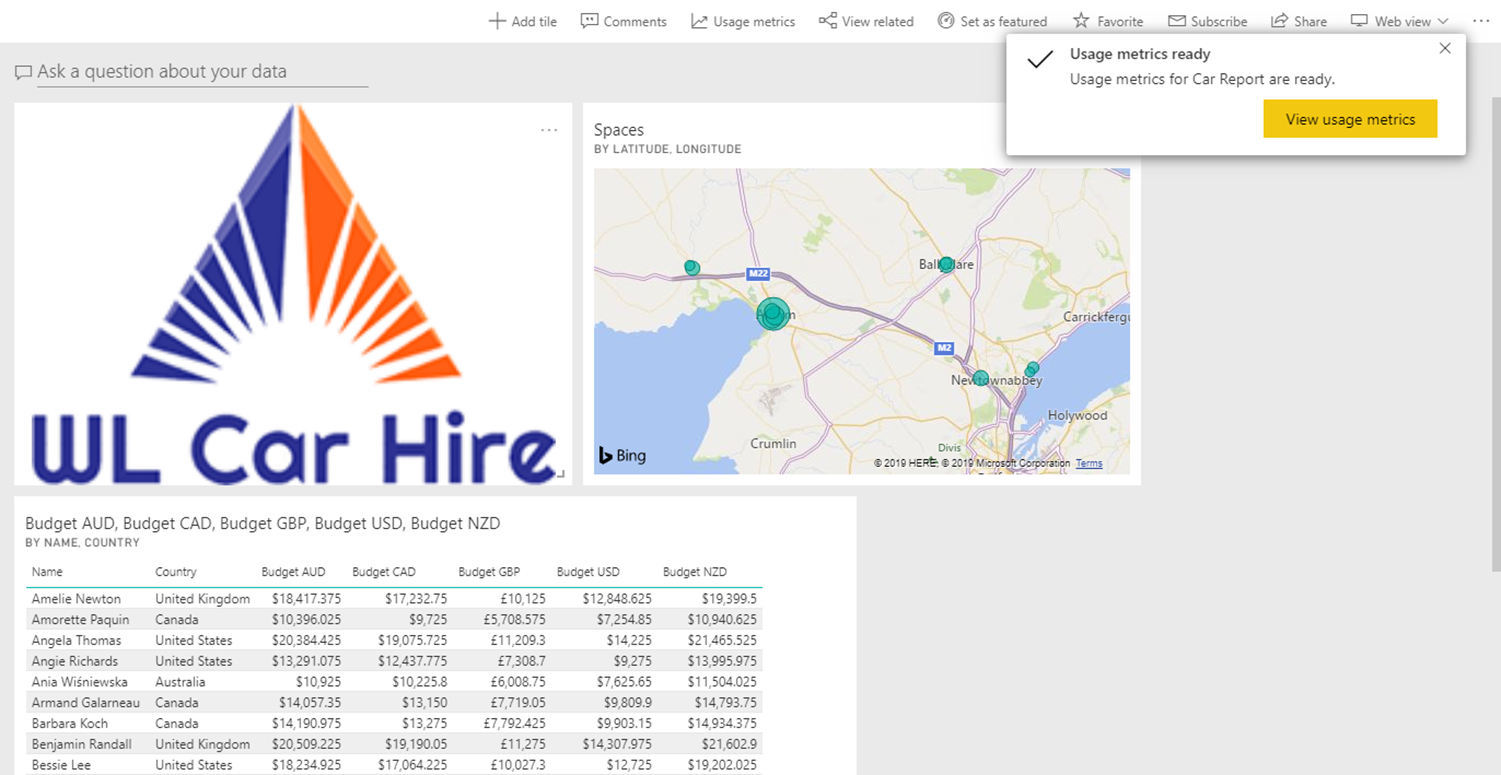
The report takes two or three minutes to be built, after which a Usage metrics ready notification will pop up.
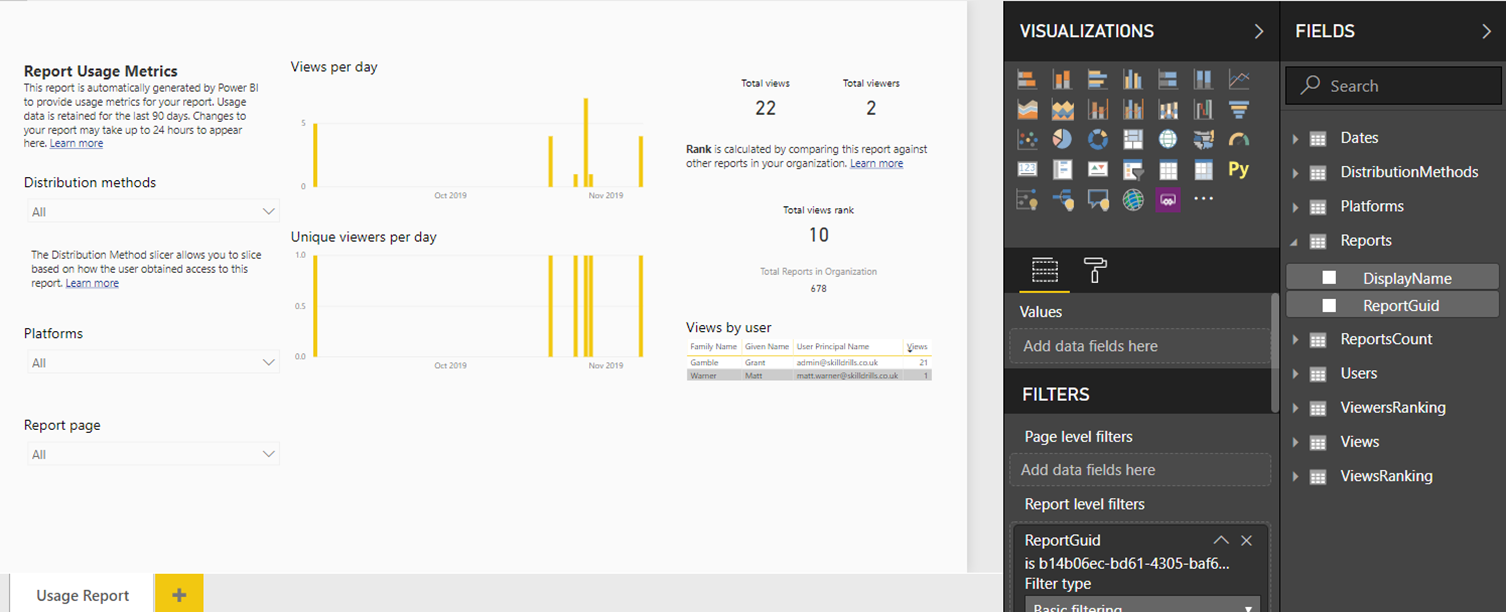
Usage metrics reports are themselves read-only. However, you can copy by clicking File > Save As. This will give you a copy of the usage report which you can edit.
You can also create your own reports in Power BI Desktop from the dataset underlying the report. This dataset exposes the usage metrics either for all dashboards or all reports in a given workspace. However, the report is filtered to only show metrics for the selected dashboard or report. While editing the report, you will notice that the field Reports[Report Guid] has been added to the report filters area and that a single item has been selected.
You can, if you wish remove this filter and view metrics for all items (either reports or dashboards) in the entire workspace.
If you want to be notified when a particular item or an entire workspace has reached a given milestone, you create a report monitoring dashboard and use the dashboard alerts feature to generate the notification.
Within Power BI, alerts must be set for each user. However, using Microsoft Flow, alerts can trigger other actions.
Dashboard alerts are attached at the tile level and they can only be used with three types of visual: cards, gauges and KPIs.
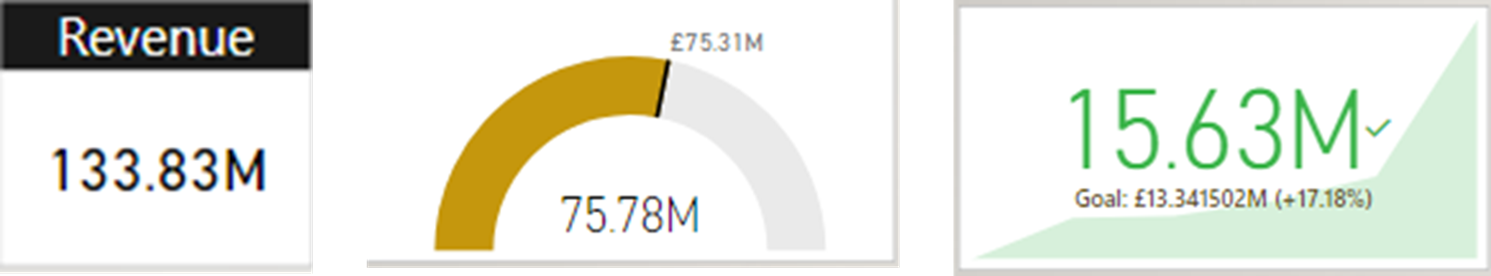
To create the dashboard, simply create a card, gauge or KPI which displays each of the metrics you wish to monitor. Then pin this visual to your monitoring dashboard.
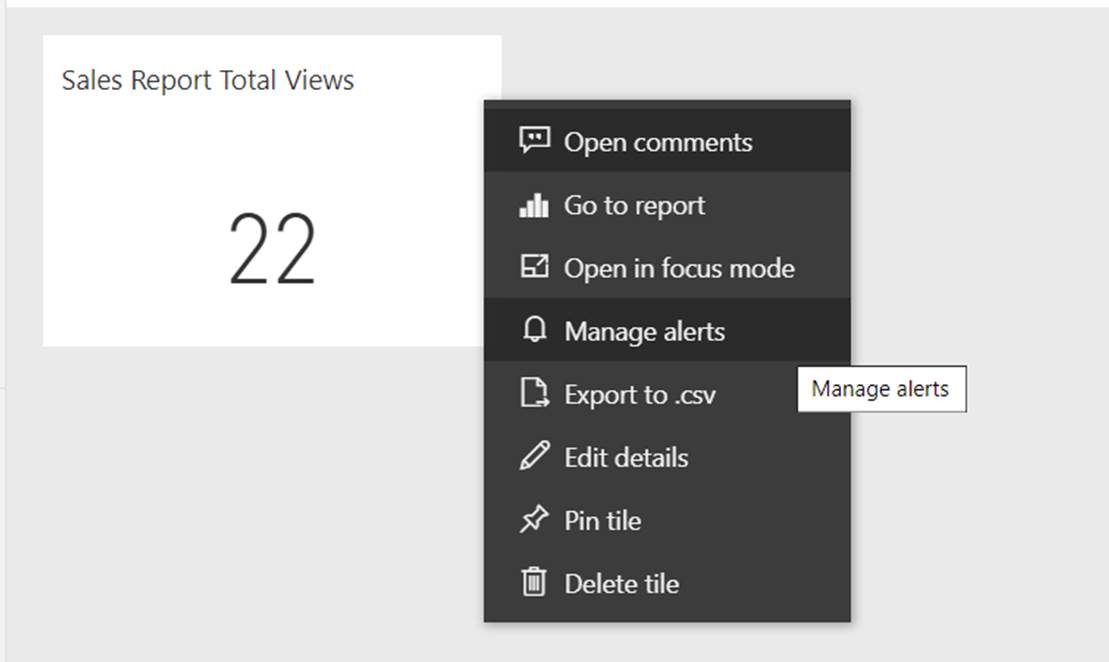
To create an alert, from a dashboard card, gauge or KPI tile, select Manage Alerts from the ellipsis menu.
On the Manage alerts pane, click Add alert rule and enter a title for the alert.
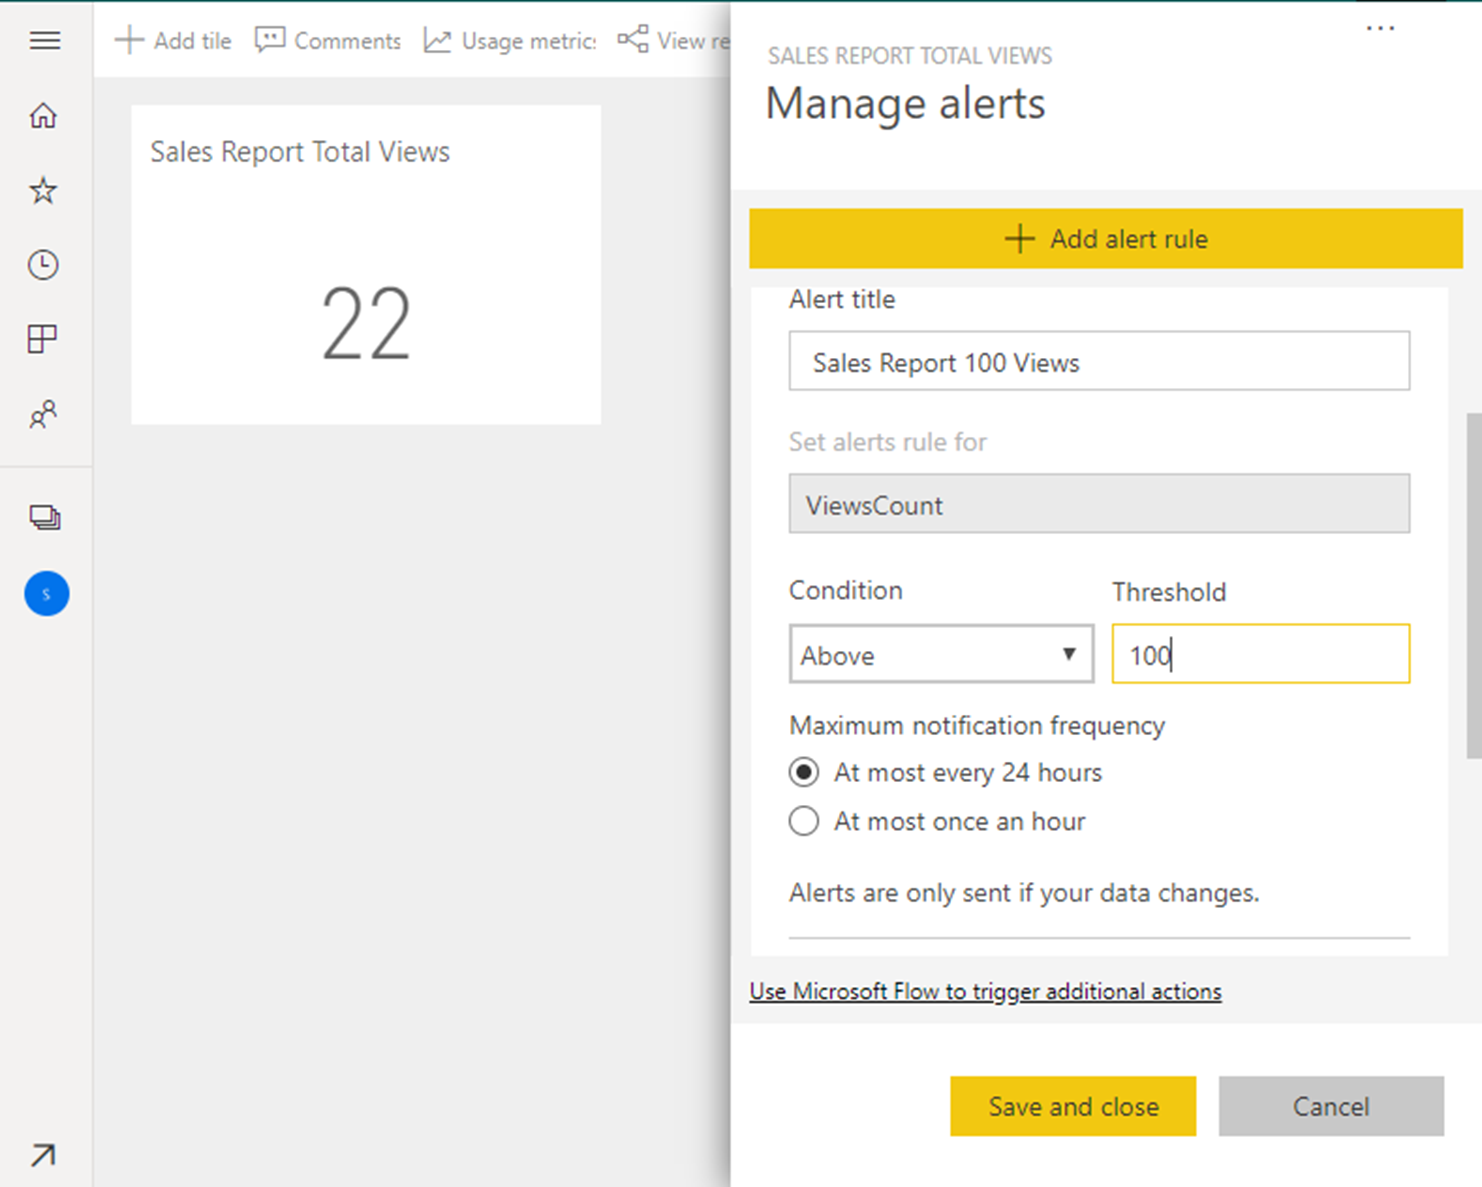
Now, as soon as your report or dashboard hits this target you will be notified and can rest assured that the hard work you put into creating it is being rewarded.